California’s energy politics are horrendous. The state has elected politicians whose only goal in life is to demagogue their way to more power of the human kind by virtue signaling their commitment to green energy. The Golden State has way overbuilt solar power and steadily eroded its energy security while making itself ever more dependent on other states for its energy at critical times. It’s raining disaster and the the ducks have gone underwater.
What I mean by this is partly illustrated in a story on Today in Energy from almost a year ago. Here are the key points:
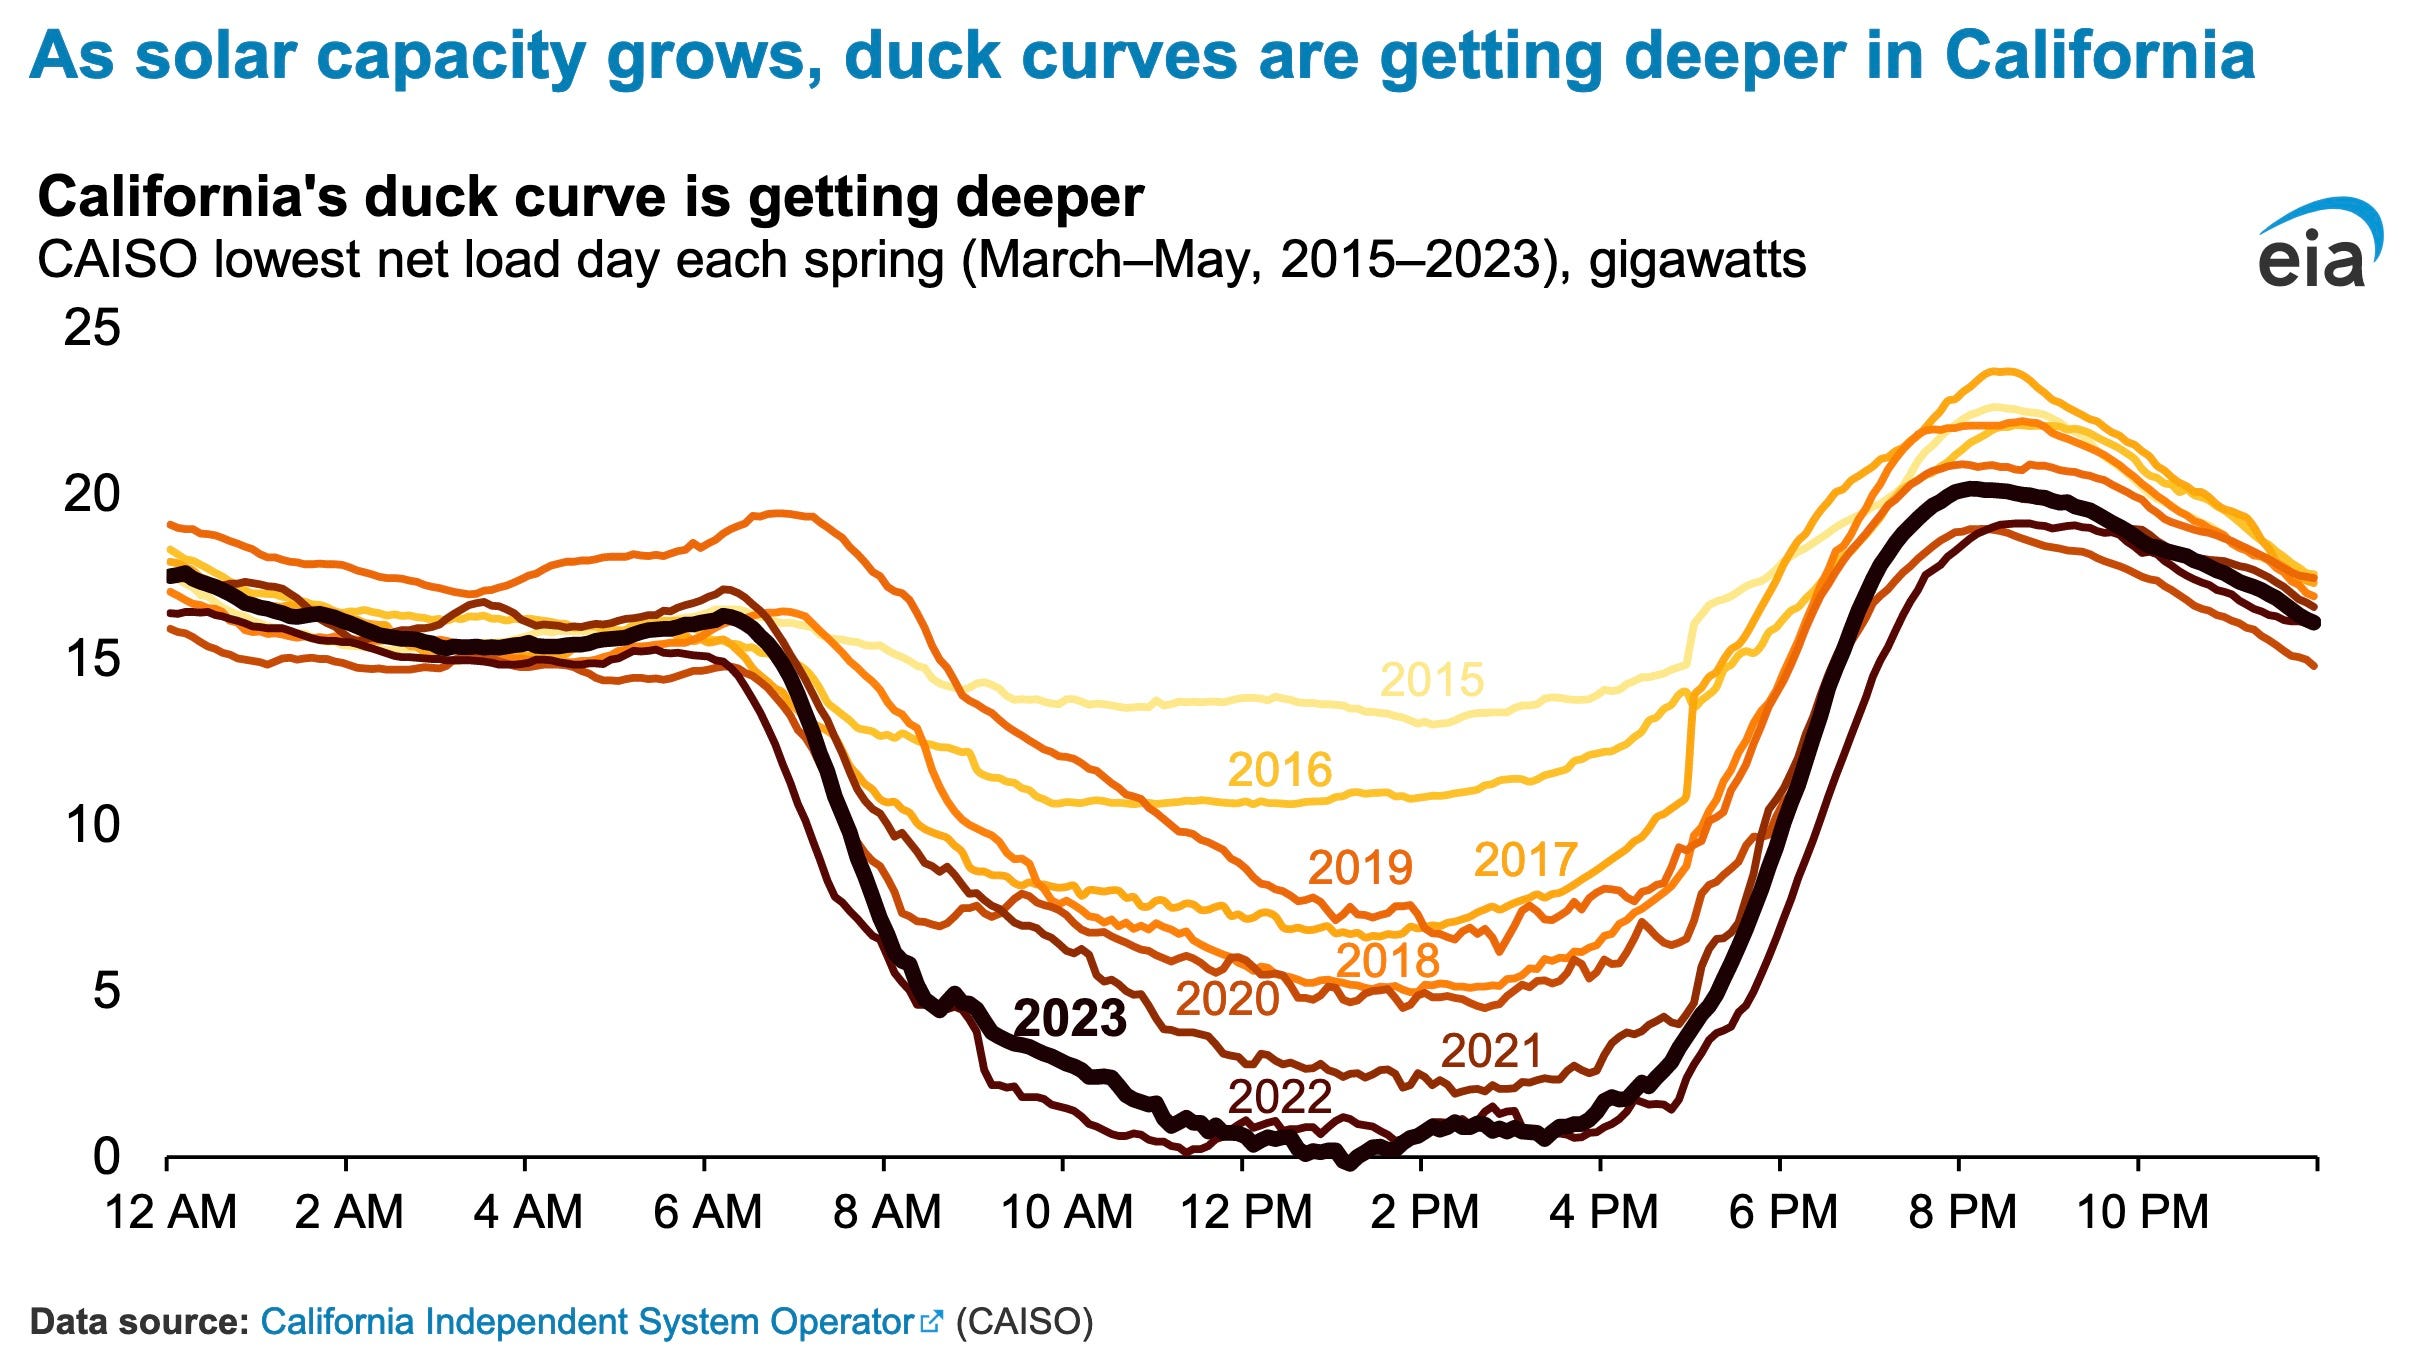
As more solar capacity has come online in California, grid operators at the California Independent System Operator (CAISO) have observed a drop in net load (or the demand remaining after subtracting variable renewable generation) in the middle of the day when solar generation tends to be highest. When graphed for a typical day, the pattern created by the midday dip in the net load curve, followed by a steep rise in the evenings when solar generation drops off, looks like the outline of a duck, so this pattern is often called a duck curve. As solar capacity in California continues to grow, the midday dip in net load is getting lower, presenting challenges for grid operators.
Grid operators constantly balance electricity generation with electricity demand in a region. Demand is lowest overnight, when most consumers are sleeping and when many businesses are closed. Demand begins to ramp up in the morning as people wake up and businesses start opening. Demand stays elevated throughout the day, rises slightly in the evening as people come home from work and residential electricity consumption increases, and then drops off again in the late evening.
Unlike conventional power plants (for example, nuclear, coal-fired, and natural gas-fired plants), solar and wind resources can’t be fully dispatched at will to help meet demand, and utilities may have to curtail them to protect grid operations. Solar power is only generated during daylight hours, peaking at midday when the sun is strongest and dropping off at sunset. As more solar capacity comes online, conventional power plants are used less often during the middle of the day, and the duck curve deepens.
The duck curve presents two challenges related to increasing solar energy adoption. The first challenge is grid stress. The extreme swing in demand for electricity from conventional power plants from midday to late evenings, when energy demand is still high but solar generation has dropped off, means that conventional power plants (such as natural gas-fired plants) must quickly ramp up electricity production to meet consumer demand. That rapid ramp up makes it more difficult for grid operators to match grid supply (the power they are generating) with grid demand in real time. In addition, if more solar power is produced than the grid can use, operators might have to curtail solar power to prevent overgeneration.
The other challenge is economic. The dynamics of the duck curve can challenge the traditional economics of dispatchable power plants because the factors contributing to the curve reduce the amount of time a conventional power plant operates, which results in reduced energy revenues. If the reduced revenues make the plants uneconomical to maintain, the plants may retire without a dispatchable replacement. Less dispatchable electricity makes it harder for grid managers to balance electricity supply and demand in a system with wide swings in net demand.
If you look closely at the chart, you will notice the duck curve now goes negative (underwater) about 1 PM every Spring day, which means there is excess energy that must be unloaded at a cost to ratepayers as a whole. And, it’s getting worse every year. It also numerous other problems. California’s energy supply is becoming ever more unabalanced and unreliable.
Moreover, until late 2022, the costs of energy, under net metering schemes, were becoming less and less equitable because those homeowners who installed subsidized solar panels were able to sell their mostly useless excess energy back to utilities at near retail prices. This meant wealthier households who could buy panels, were shifting costs to poorer households who could not.
It was a mess and something had to be done. So, California, out of unavoidable necessity, enacted new rules that effectively cut the heart of net metering, reducing the unfair advantages given to those wealthier households (and solar grifters) by 75% or so. The result? Well, check out this story:
The state Public Utilities Commission in late 2022 slashed by about 75% the rate that utilities pay homeowners with new solar panels when they sell surplus power to the grid. The rate structure went into effect for solar applicants beginning last April.
The state’s decision has caused consumer demand for residential solar to plummet since the new rate took effect. Solar companies say they’ve been shoved to the edge of a cliff, forcing them to lay off workers or even shut down.
Experts worry that the steep decline could stall the state’s battle against climate change. Solar power is critical to meeting California’s ambitious requirement to switch to 90% carbon-free electricity in 2035 and 100% in 2045. Large-scale and rooftop solar is projected to provide more than half of the grid’s power by 2045.
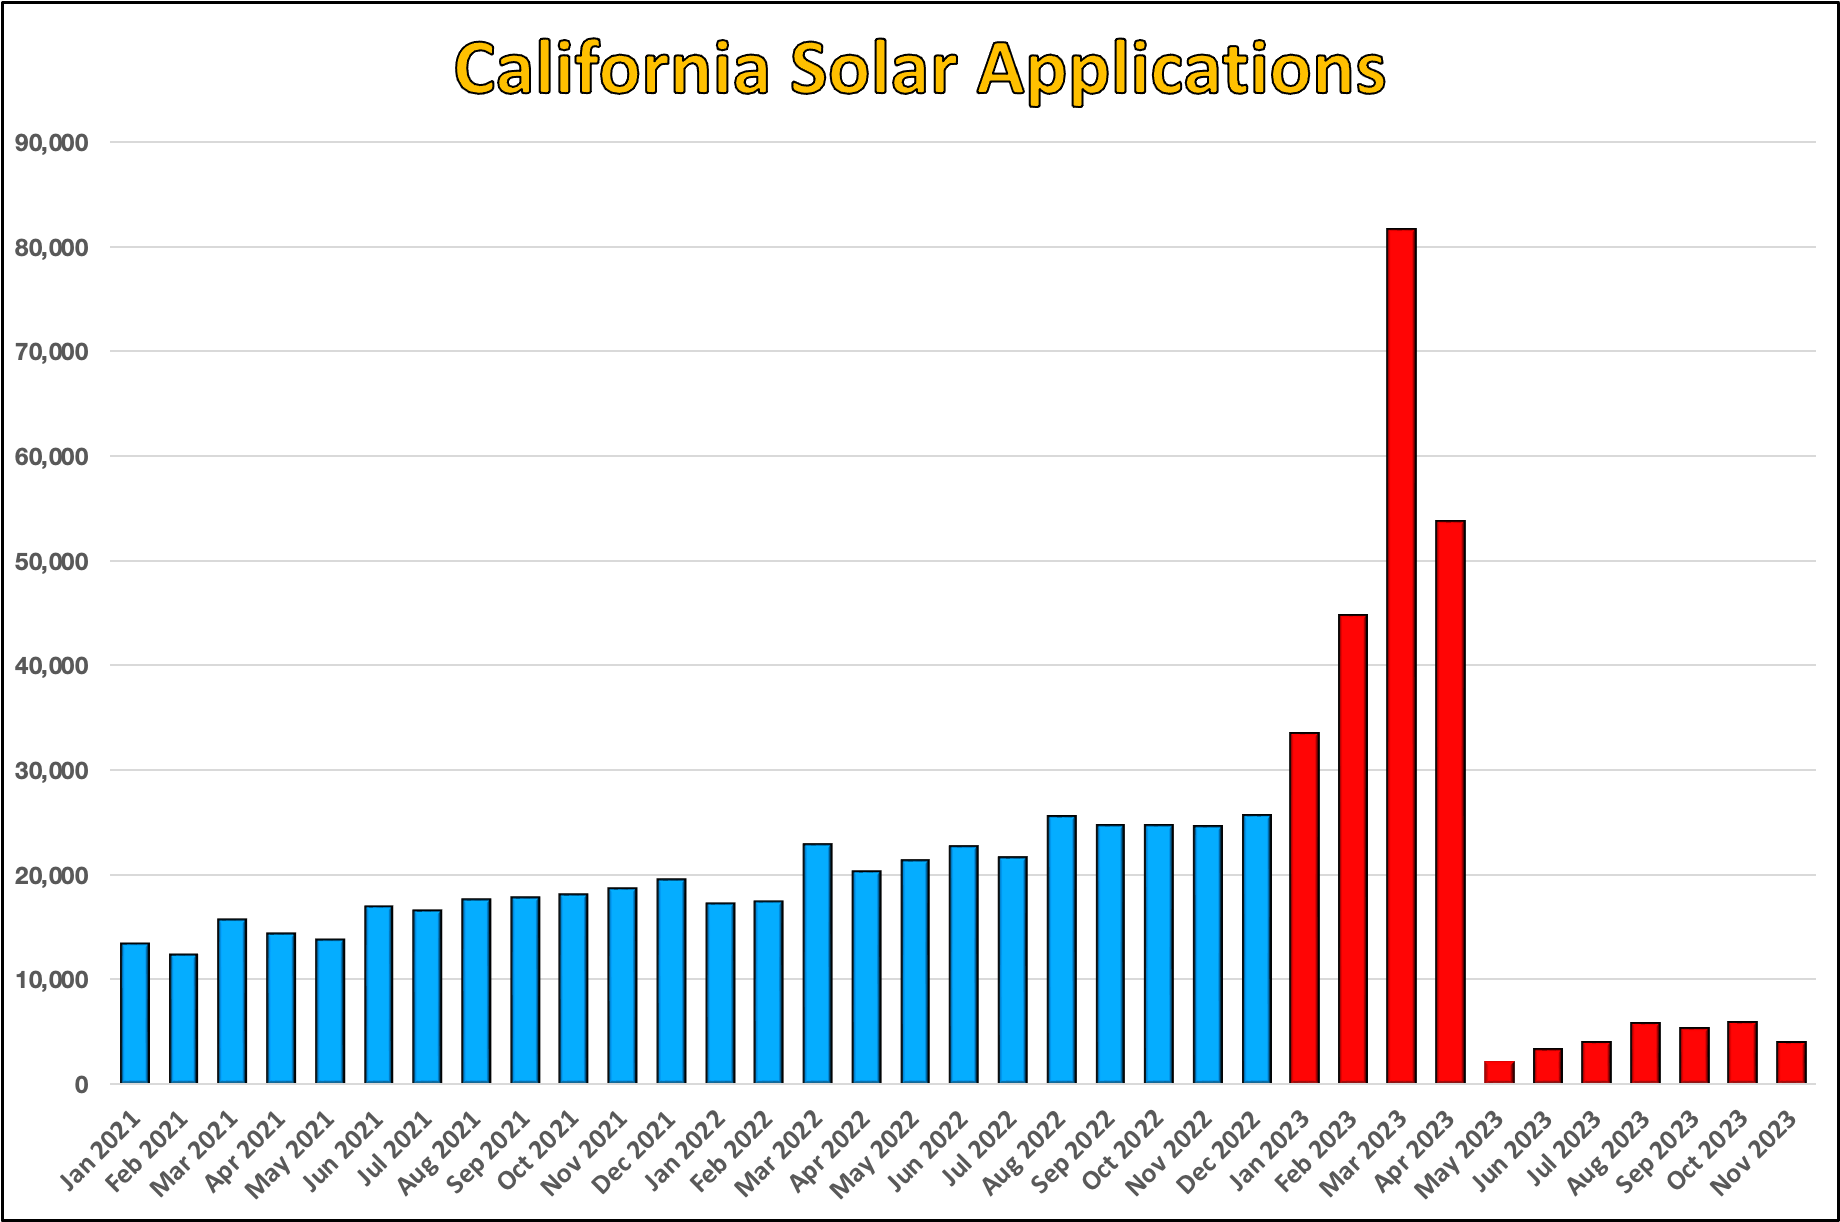
The imminent change in payments to customers drove a three-month surge in homeowners applying for solar connections leading up to the deadline. But then came a 90% decline last May compared to May of 2022, according to state data for areas served by Pacific Gas & Electric, Southern California Edison and San Diego Gas & Electric.
In all, about 82% fewer customers applied for solar connections from May through November of last year compared to a year earlier. Fewer than 4,000 customers applied in November, the last month with available data…
Deepak Rajagopal, an energy economist at UCLA’s Institute of Environment and Sustainability, said it’s no surprise that consumers balked at going solar after the reimbursement rate changed from what he called the “generous” system. He said the higher payments were a burden on people who don’t have solar…
The new rule’s impact on the solar industry has been immediate. As many as 17,000 solar workers in California might have lost their jobs by the end of last year, according to industry estimates.
This chart says it all:
Nobody wants solar, in other words, unless they’re paid to take it. The duck has gone underwater again. Golden State environmental warriors and grifters are screaming bloody murder over the result but it was inevitable. As a famous economist once said, “what can’t go on, won’t.” All free rides come to an end at some point and the return to reality can be painful in the extreme but there was no choice and soon other states doing net metering and overbuilding solar will be in the precise same situation. And, duck curves aren’t the worst. Geese can bite after all, and they’ll chase you to boot, so it’s best to shoot now.
I like the rain analogy. In the rainy Pacific Northwest, where Lewis and Clark and company became extremely depressed during the rainy winter at the mouth of the Columbia, we have a saying, coined by former governor McCall, in trying to encourage Californians to stay home, "Oregonians don't tan - they rust".
Your comment "The dynamics of the duck curve can challenge the traditional economics of dispatchable power plants because the factors contributing to the curve reduce the amount of time a conventional power plant operates, which results in reduced energy revenues" reminds me of a basic business principle - highest and best use. The highest and best use of any power source is if it can be utilized continuously, 24/7. Coal, gas, and nuclear have the potential for highest and best use; solar doesn't even come close.


Powerful, Mr. Shepstone! How long can California last, before they have another Gray Davis moment?
I like the rain analogy. In the rainy Pacific Northwest, where Lewis and Clark and company became extremely depressed during the rainy winter at the mouth of the Columbia, we have a saying, coined by former governor McCall, in trying to encourage Californians to stay home, "Oregonians don't tan - they rust".
Your comment "The dynamics of the duck curve can challenge the traditional economics of dispatchable power plants because the factors contributing to the curve reduce the amount of time a conventional power plant operates, which results in reduced energy revenues" reminds me of a basic business principle - highest and best use. The highest and best use of any power source is if it can be utilized continuously, 24/7. Coal, gas, and nuclear have the potential for highest and best use; solar doesn't even come close.