


You Can't Measure the Earth's Temperature by Putting A Thermometer Next to A Heat Source for Crying Out Loud
Guest Post by Roger Caiazza of Pragmatic Environmentalist of New York.
The subject of global warming has been a primary focus of this blog since the beginning. I think it is obvious that I am skeptical of the narrative that there is an existential threat of climate change. This post describes one of the reasons for my skepticism – the unrecognized difficulty of measuring long-term temperature trends.
Background
My fifty-odd year career as an air pollution meteorologist in the electric utility sector has always focused on meteorological and pollution measurements. Common measurement challenges are properly characterizing the parameter in question, measuring it in such a way that the location of the sensor does not affect the results, and, when operating a monitoring system, verifying the data and checking for trends. On the face of it, that is easy. In reality, it is much more difficult than commonly supposed.
According to the Britannica website global warming is “the phenomenon of increasing average air temperatures near the surface of Earth over the past one to two centuries” and states “the best estimate of the increase in global average surface temperature between 1850 and 2019 was 1.07 °C (1.9 °F).”
This post will only address the how it is warming and not the why it is warming. However, keep in mind that the interest in global temperature trends is related to the supposition that mankind has added greenhouse gases to the atmosphere that impact temperature trends everywhere.
Temperature Trend Measurement Issues
It has been my experience that anything associated with climate change issues is more complicated than it appears at first. Britannica claims global warming has been the change in the surface temperature since 1850. When I was responsible for setting up a meteorological monitoring network my first concern was the general location of the monitoring sites relative to the goal of the problem. I wanted to site monitors evenly across the area of concern to represent what was happening. In this case where and how should we sample for a global average.
The first global warming measurement challenge is representativeness. Consider that 70% of the earth’s surface is covered by water and that long-term measurements are only available where people have been living. Long-term measurements in the oceans are on islands and human settlements are not evenly distributed across the globe. The Argo program addresses the ocean temperature representativeness issue with a system of 3,000 instrumented floats but it only has data since November 2007. The Britannica global average temperature is not based on a representative global sample since 1850.
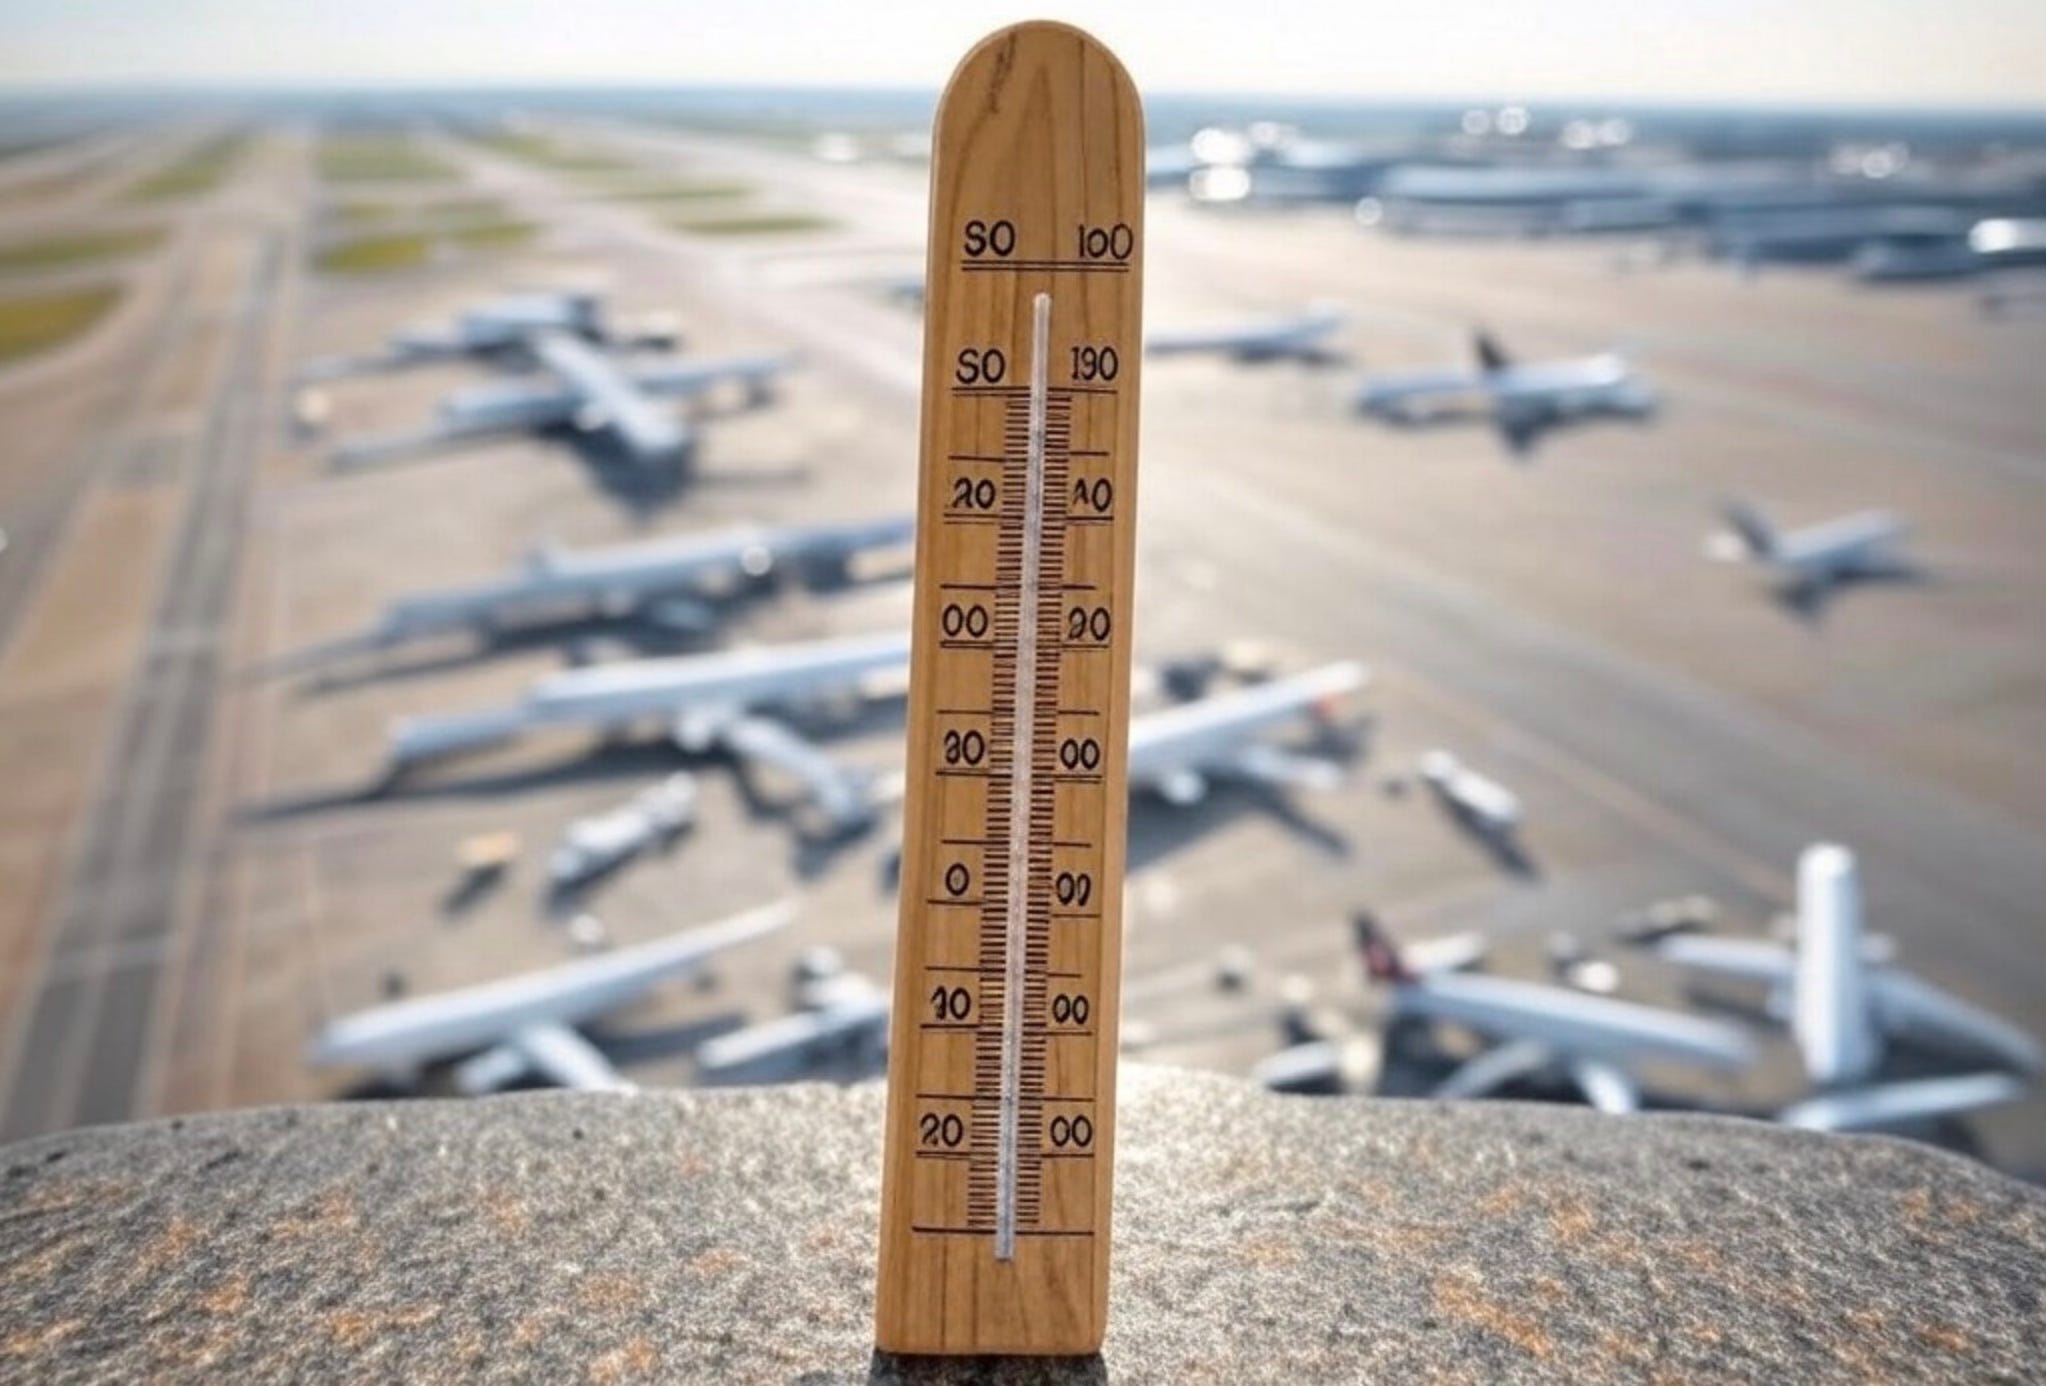
There is another representativeness issue that is even more of a concern. The location of the monitor is critical if we are to compare measurements at one location to another. Sensors should not be unduly affected by their surroundings. For example, it is inappropriate to put a temperature sensor next to an external source of heat like an air conditioning system. Another issue is that building and paved areas retain heat more than rural areas in what is called the urban heat island. Temperature sensors should also be a minimum distance away from trees.
The National Weather Service and the World Meteorological Organization (WMO) both have standards and guides for siting instruments that address these concerns. Finally note that the WMO has a classification system for measuring stations. Ideally, the only sites used for the global average would be those that meet the most stringent WMO acceptability criteria. Using sites that do not meet those criteria in a trend analysis means local factors other than greenhouse warming could be influencing the observed trend.
A final representativeness trends concern is that siting standards should be constant over the period of record. Consider that the longest measuring site in New York City is in Central Park. The surroundings for that sensor have changed over time so there should not be high confidence that the warming trend observed there is caused solely by global greenhouse gas warming.
There is another long-term trend concern – measurement methodology. The longest running instrumental temperature record is the Central England Temperature (CET) series. The United Kingdom’s Met Office notes that “By collating and combining early instrumental records, the series charts monthly temperature statistics from 1659.” Suffice to say that the temperature data collected for most of the record were observations of a thermometer, so this introduces human eyeball error.
For locations where temperature records are still manually collected, observers note the maximum and minimum temperature recorded on an instrument that measures both values daily. The first reliable max-min thermometer was invented in 1780 by James Six. I do not know when the measurements used for the CET switched to this technology but the change in technique affects interpretation of the trend.
A bias can be introduced if the time of observation changes. If observations are taken and the max-min thermometers are reset near the time of daily highs or lows, then an extreme event can affect two days and the resulting long-term averages.
Today, many locations report temperature measured at locations with data acquisition computers. Typically, those instrumental systems make observations every second, compute and save minute averages that are used to calculate and report hourly and daily averages. Locations that have been measuring temperature for a long time may have started with manual observations and now use electronic observations. This shift in methodology will affect the trend.
Trend Reporting
My focus in this article is the measurement of long-term temperature trends. In the case of a daily average the issues described are small but cumulatively I believe are on the order of the observed trend. However, unscrupulous advocates have been known to breathlessly report a new record temperature that they use to incite action. For example, if a temperature sensor is improperly located so close to an airport runway that jet exhaust affects the temperature, and the maximum temperature reported is a one-minute average value, then the soundbite record temperature likely only represents the effect of jet exhaust.
I want to mention one final aspect of measuring programs that epitomizes an acceptable monitoring system. There must be a quality assurance and quality control system in place. Those programs include routine checks on the instruments and a verification process for the data itself. For example, data verification was one of my responsibilities and I developed a program to evaluate data for potential problems.
If the observed wind direction data was constant for hours, the temperature was below freezing and there was precipitation, that indicated that freezing rain had frozen the wind vane in place. I believe that climatological temperature reporting protocols include this step. It is only when someone with a mission goes for the headline and unscrupulously reports data out of context that this can be a problem.

Conclusion
I prepared this article to highlight recognized instrumental and observational biases in the temperature measurements. Individually the instrumental effects are small but cumulatively they can be on the same order as the trend. The siting representativeness issues are a much bigger concern. I have no doubts that the trends observed in many locations are primarily caused by increased urbanization and other local infrastructure changes affecting the measurements.
The Britannica website states, “the best estimate of the increase in global average surface temperature between 1850 and 2019 was 1.07 °C (1.9 °F).” I believe that it is absurd to claim that level of precision given the issues I described. Saying 1 °C (2 °F) is all you should say with any confidence but even that is low confidence in my opinion. There is no question that there has been warming since the end of the Little Ice Age in 1850 but the amount and reason for the warming are debatable.
#Caiazza #Climate #Temperature #GlobalWarming #Measurement
Roger Caiazza blogs on New York energy and environmental issues at Pragmatic Environmentalist of New York. This post represents his opinion alone and not the opinion of his previous employers or any other company with which he has been associated. Roger has followed the Climate Leadership & Community Protection Act (Climate Act) since it was first proposed, submitted comments on the Climate Act implementation plan, and has written over 480 articles about New York’s net-zero transition.

The lack of common sense is a hallmark of the climatocatastrophists. They have nothing else, just an ideology and use anything to prove up their belief false as it is - even editing raw measurements data.
Urban heat island effect. Well known here in Phoenix.