


There's A Whole Lot More to Climate Entertainment Than the Tree Ring Circus

Climate science depends, to a large degree, on climate history. Documenting that history prior to the recording of thermometer temperature readings depends on proxies. The most common proxy has been tree ring widths. Michael Mann built a career out of using them to create his infamous hockey stick graphic that became the basis of an entire tree ring circus.
But, tree rings are hardly the only proxies and non-tree proxies such as ice cores, lake and marine sediments, boreholes, and speleothems (mineral formations accumulating caves over time) are often more useful. This is because there is both short-term (periods of less than 200 years) and long-term (periods of more than 200 years) variability in climate and the trends can be quite different.
One of the reasons trends can be so different is that climate tends to greatly affected by volcanic activity, which has both short and long effects. Tree rings work best in evaluating the short-term trends, while non-tree ring data seems to measure the long-term effects better. The most important point, though, is that are multiple proxies for temperature. There is a whole lot more climate entertainment beyond the tree ring circus.
Such entertainment is provided by a recent study published in the Science China Earth Sciences journal. It is titled “The Influence of Proxy Selection on Global Annual Mean Temperature Reconstructions During the Common Era.” The study is a far too typical academic product, with the usual reluctance to speak clearly or challenge prevailing narratives. Notwithstanding this, there are some remarkable charts in the report that tell quite a story.
The charts “infer the annual mean temperature histories for the Northern Hemisphere (NH), the Southern Hemisphere (SH) and the entire globe (GL), respectively.” Consider these two, in particular:
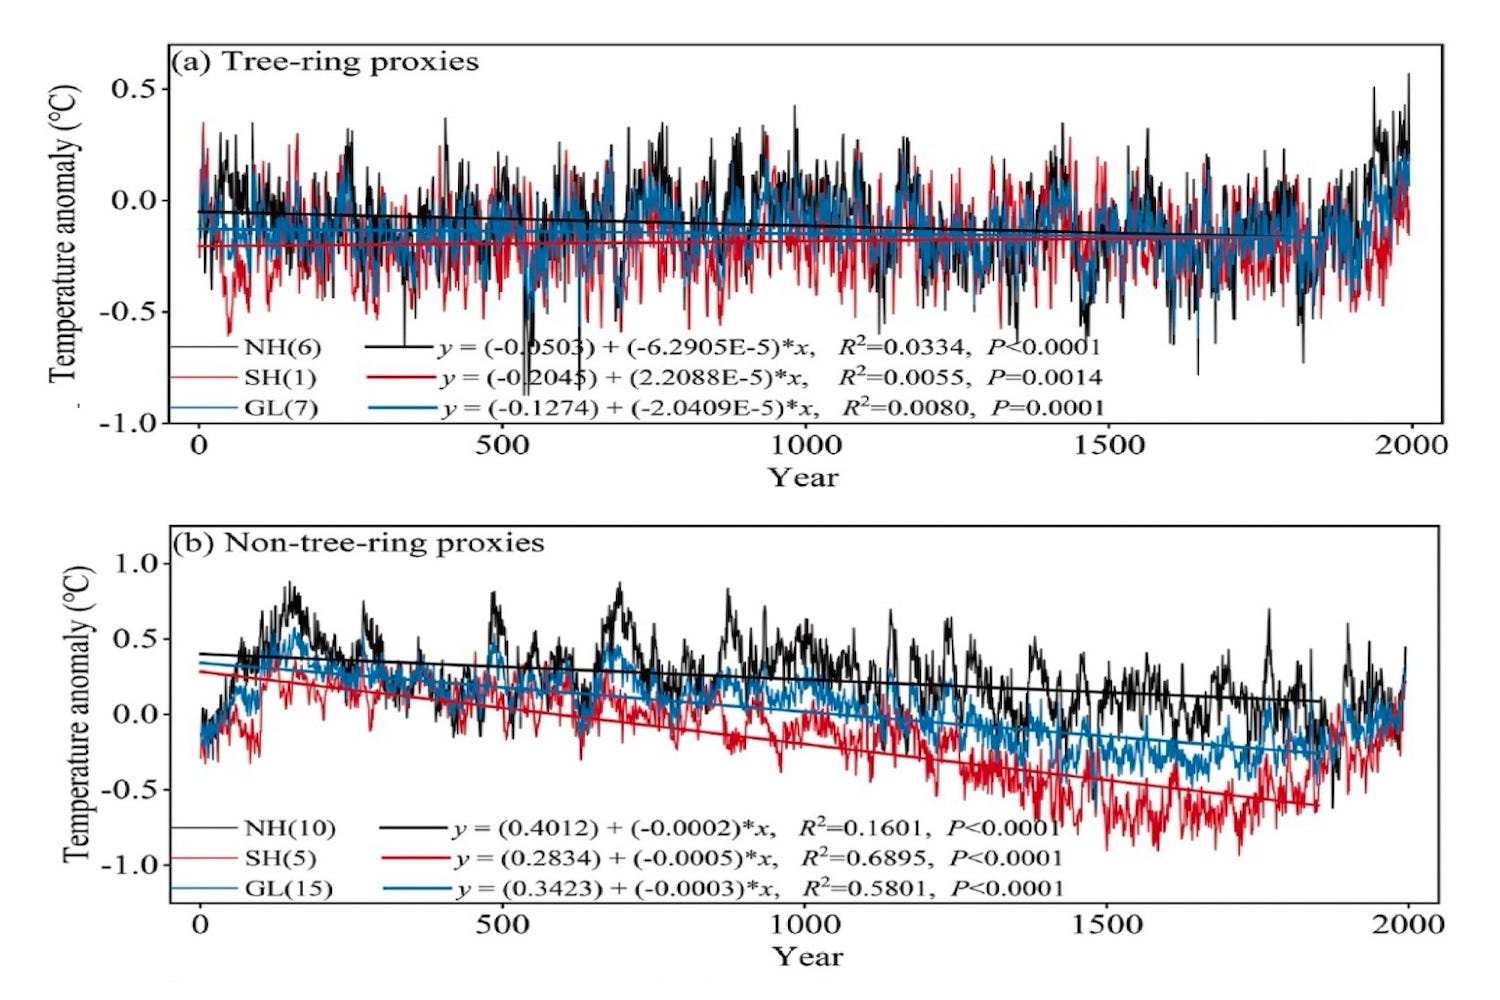
Notice the trend lines, which only extend from year zero to about 1800. This is the period about which the study was conducted. This period provides the foundation for evaluating what has happened over the last 200 years. Getting it correct, therefore, is crucially important. If the trend lines are flatter, recent temperatures are effectively exaggerated as to impact. That is exactly what happens when tree ring proxies are used.
But, notice what happens when non-tree-ring proxies are used; the trend lines reflect declining temperature anomalies over time and offer a quite different perspective on more recent temperatures. Indeed, the global temperature anomaly (blue line) goes negative for many centuries prior to the last 200 years, meaning the latter merely reflects a temperature bounce back, if you will. And, the most recent period fails to rise to the level of various earlier parts of the last two millennia.
This is but one study, of course, but it demonstrates the hollowness of the climate cult’s claims. Think about that every time you read how we’re in "climate crisis” or some major institution blindly following the narrative for the sake of political correctness tells you what they're doing to reduce emissions. It's all a tree ring circus and little more.
#Mann #TreeRings #Climate #Temperatures #Science #Volcanos #ClimateProxies entire s

I love it when you are strict, Tom. “Facts, facts, stupid facts”