


The Phantom Energy Transition Is Not What It May Seem If You're Not Looking Hard at the Data

Today In Energy delivered some truth about the energy transition yesterday with this post, although there’s also some misleading information. You might think from this table, in fact, that a transition was happening faster than a speeding bullet:
But notice the left side of the chart where Btu values are listed: they’re minimal. Now, look at this chart:
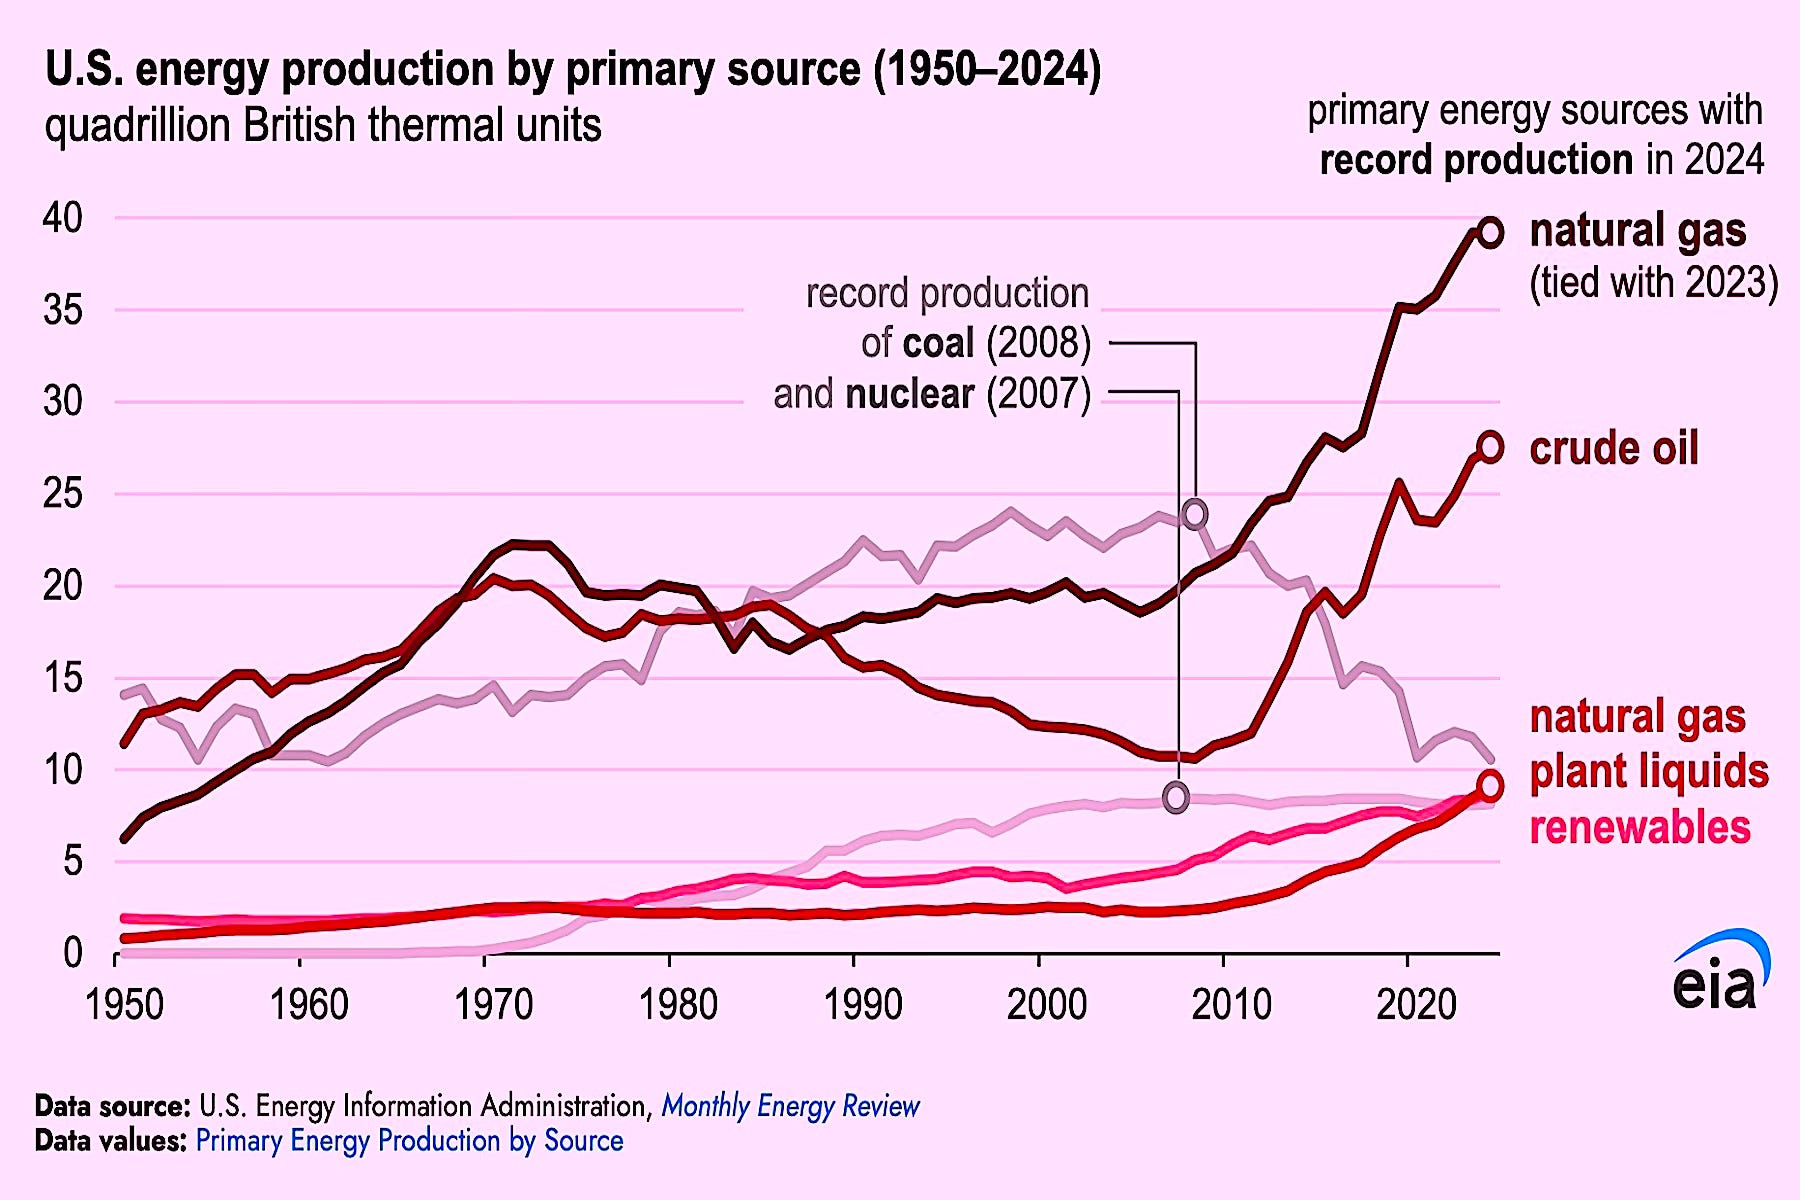
Natural gas, crude oil, Natural gas plant liquids, coal and nuclear account for something on the order of 35 times solar and wind combined, although the latter are always hyped. Here’s more from the story (emphasis added):
In 2024, the United States produced a record amount of energy, according to data in our Monthly Energy Review. U.S. total energy production was more than 103 quadrillion British thermal units in 2024, a 1% increase from the previous record set in 2023. Several energy sources—natural gas, crude oil, natural gas plant liquids, biofuels, solar, and wind—each set domestic production records last year.
Natural gas accounted for about 38% of U.S. total energy production in 2024 and has been the largest source of U.S. domestic energy production every year since 2011, when it surpassed coal. U.S. dry natural gas production was nearly 38 trillion cubic feet, about the same as in 2023.
Domestic crude oil accounted for about 27% of U.S. total energy production in 2024, as the United States continues to be the world’s top crude oil-producing country. U.S. crude oil production was a record 13.2 million barrels per day in 2024, 2% more than the previous record set in 2023. Almost all of the production growth came from the Permian region that spans parts of New Mexico and Texas.
Coal accounted for about 10% of U.S. total energy production in 2024. At 512 million short tons, last year’s coal production was the lowest annual output since 1964. Coal was the largest source of U.S. energy production from 1984 through 2010.
Natural gas plant liquids (NGPL), which includes fuels such as ethane and propane that are associated with natural gas processing, accounted for about 9% of U.S. total energy production in 2024. NGPL production was a record 4 trillion cubic feet in 2024, up 7% from 2023. Domestic NGPL production have increased every year since 2005 as U.S. natural gas production and processing capacity have increased.
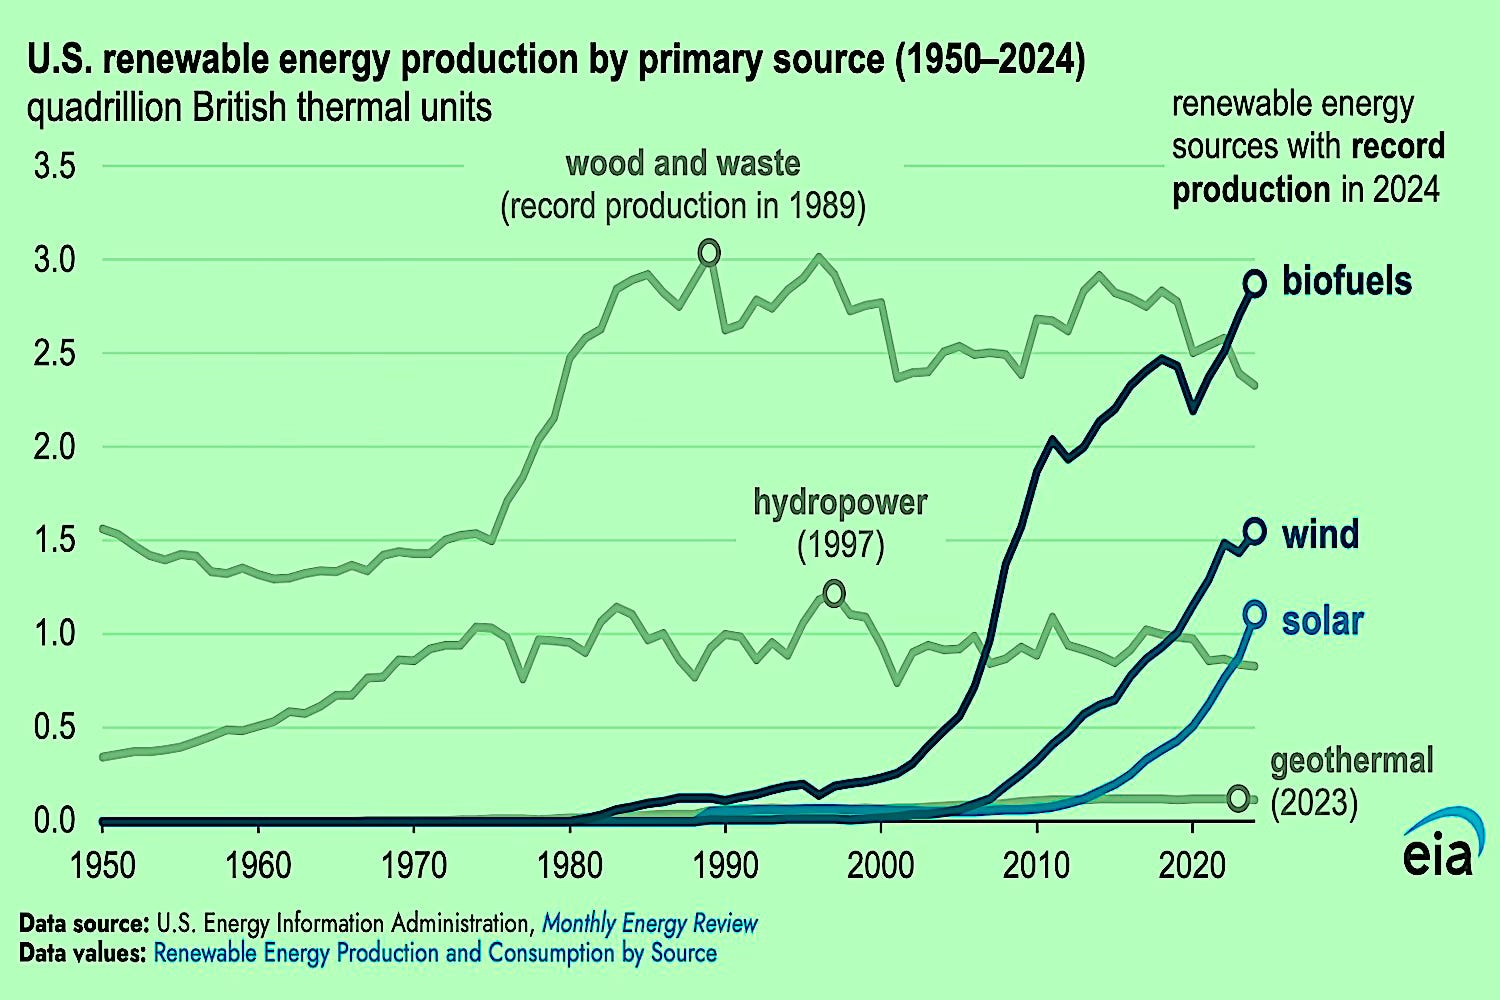
Notice the article text doesn’t provide the total amount of solar and wind energy produced (a good part of which is useless or has to be curtailed) but we can see from the first chart it's only about 2.5 quadrillion Btus. That’s why renewables have to be charted separately so we can see them. Otherwise, we get this:
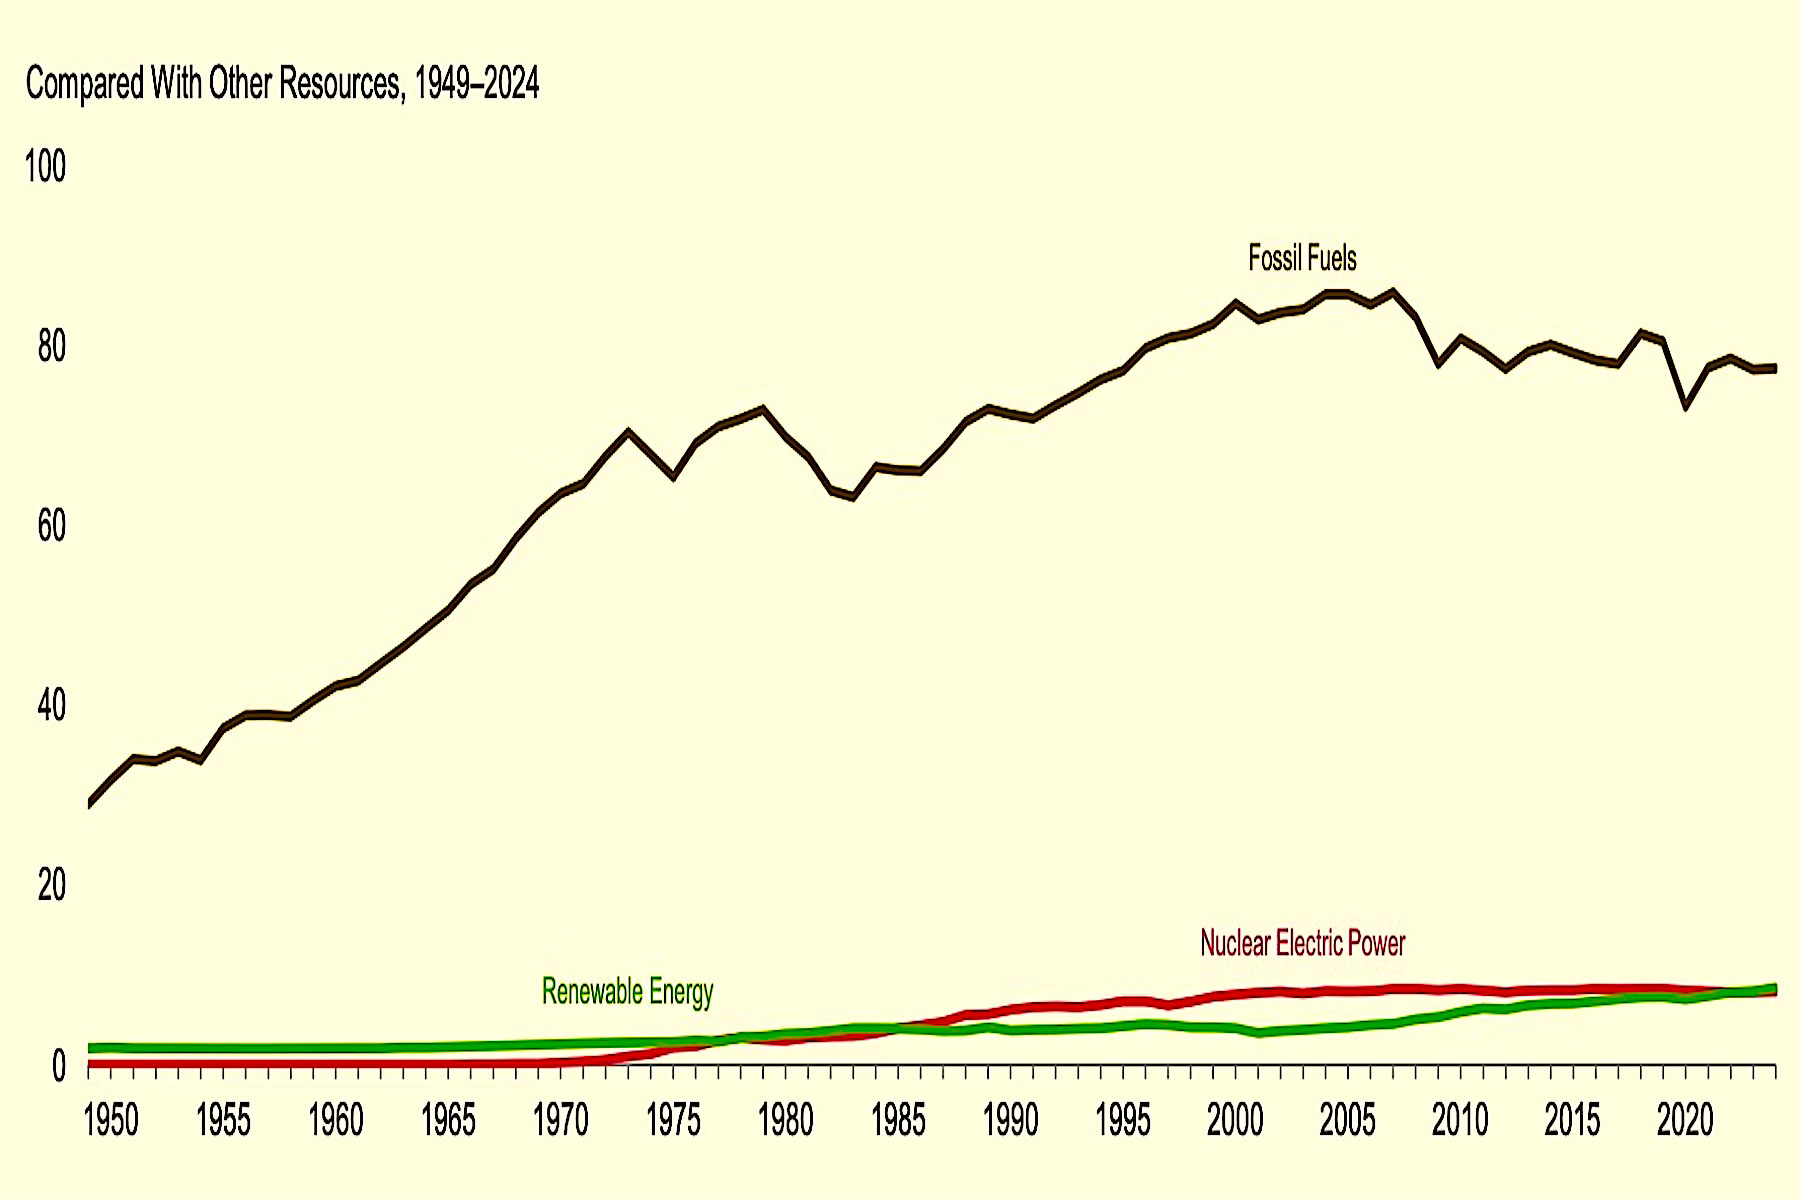
And, “renewable energy” on this graph includes biomass, geothermal and hydro. That’s the only way to make solar and wind impacts even noticeable. Such is the energy transition that is the subject of intense bragging everywhere on utillity sites, regulatory sites, and even Today In Energy, which is relatively unbiased.
#Electricity #Energy #Renewables #TodayInEnergy #EnergyTransition

This data tells us that chasing so called "green energy" and "net zero" for the past 35+ years, and pouring trillions in taxpayer funds to these ends, has been a complete and utter bust. The accountability begins with those we elect and our education system. We need more engineers and self made businessmen as leaders at every public level, not Ivy College Graduates and Lawyers, who've never built anything or managed a payroll?
Thanks - very good points. It also occurred to me that hydropower and geothermal should probably be separated from wind and solar, because hydropower needs no subsidies, and geothermal can be fairly efficient in certain situations. There's also a difference between private off grid use for solar and biomass. My woodstove needs no subsidies. All these get lumped together as 'renewables' as if they were on equal footing.