


Natural Gas Provided the Power Needed to Cool Down on July 9 As Wind Generation Dropped by 77%

Today In Energy, the blog put out by the Energy Information Administration, reported the following on Friday (emphasis added):
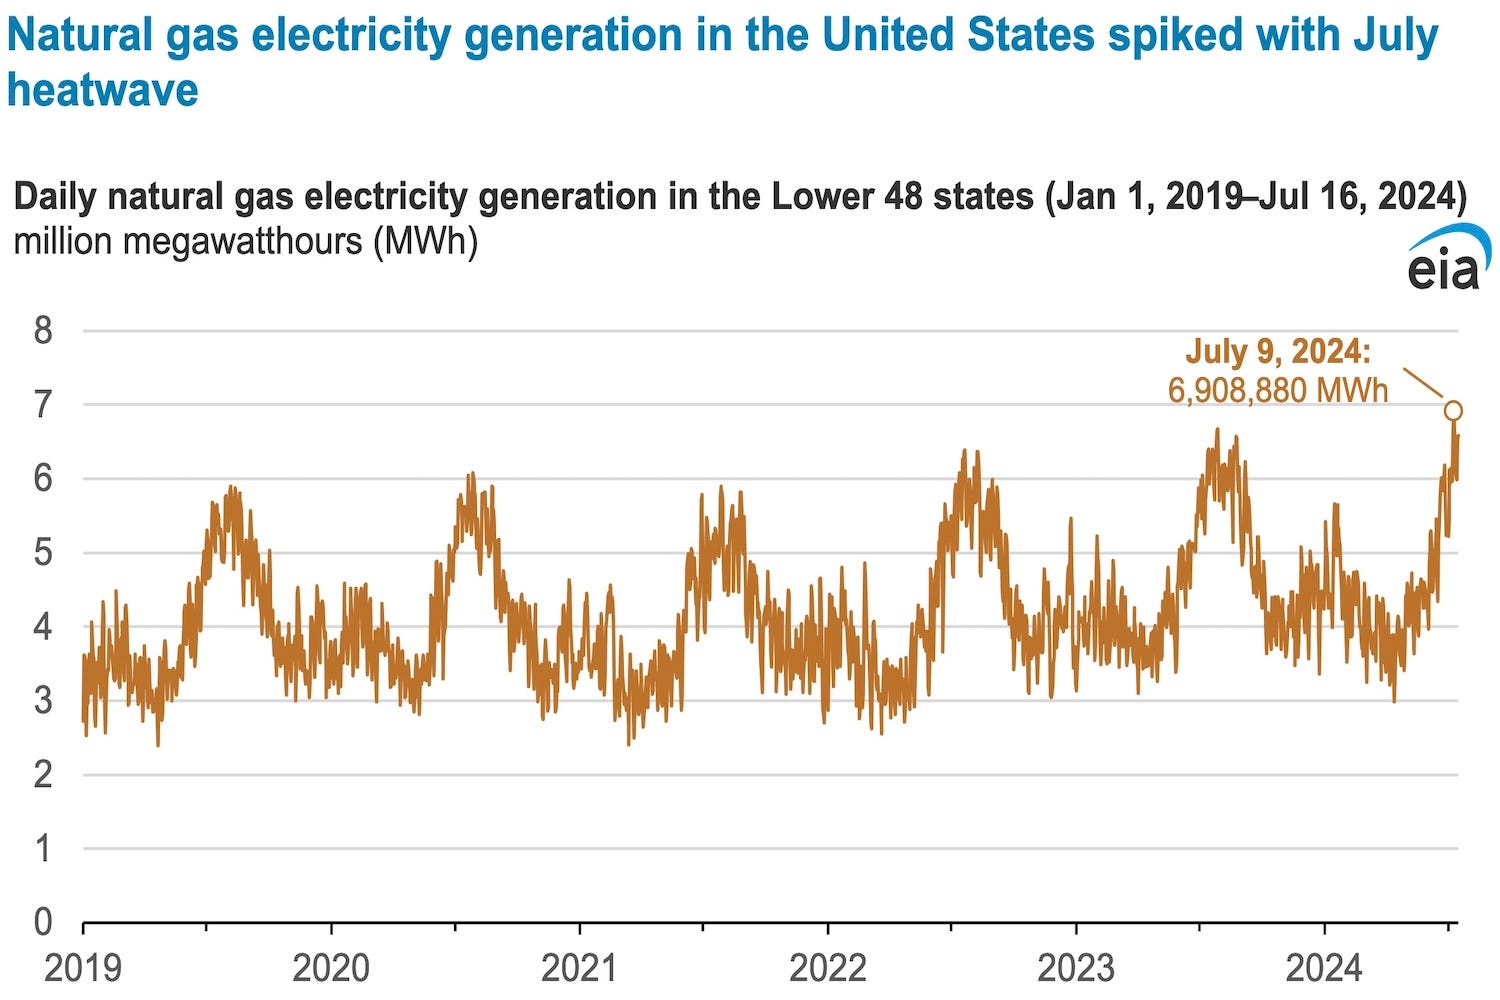
U.S. power plant operators generated 6.9 million megawatthours (MWh) of electricity from natural gas on a daily basis in the Lower 48 states on July 9, 2024, probably the most in history and certainly since at least January 1, 2019, when we began to collect hourly data about natural gas generation.
The spike in natural gas-fired generation on July 9 was because of both high temperatures across most of the country and a steep drop in wind generation.
According to the National Weather Service, most of the United States experienced temperatures well above average on July 9, 2024. Temperatures were particularly high on the West Coast and East Coast.
Wind generation in the Lower 48 states totaled 0.3 million MWh on July 9, 2024, much lower than the 1.3 million MWh daily average in June 2024.
That last bullet is particularly relevant, as it indicates how dangerous it is to rely on wind energy in times of need. But natural gas came through because it’s dispatchable and can reliably rise to the occasion when solar and wind fail. The same, of course, can be said of coal and nuclear. All three are able to deliver. Coal and nuclear, too, have the benefit of easy fuel storage on-site. Natural gas can, itself, also be backed up oil storage on-site if FERC would get out of the way and allow it without hassle.
Regardless, it is those three energy sources — coal, natural gas and nuclear — that ensure our energy security. That much was demonstrated on July 9, 2024, as this chart shows us:
Oh, yes!
#NaturalGas #Oil #Coal #Energy #Nuclear

Interesting to see how NG powered electricity production peaks in the summer. Even the coldest parts of the country still seem to use more energy to cool themselves when hot than to warm themselves when cold. Or is this just an artifact of centralized electricity production and localized heating skewing the graph?
Is that only increasing because of the strategy to replace coal power with methane gas?