Whether It's the Unprecedented Green Subsidies or His War on American Energy, Biden Raised Electric Prices to the Moon
Guest Post by Bill Peacock at Master Resource.
During the first three years under Biden vs. last three under Trump, average wholesale electric prices in the seven U.S. independent or regional service areas have increased by 72%. Retail prices are also higher. The average 2024 U.S. residential rate to date is 24% higher than in 2020. For all end users—residential, commercial, industrial, and transportation sectors—prices are up 23%.
This rate surge reflects the massive renewable energy subsidies authorized in the Inflation Reduction Act of 2022, signed by President Biden, that tripled the outlay of such federal largesse. Another factor is the administration’s natural gas policies, which banned imports of Russian oil, liquefied natural gas, and coal; joined with the European Commission to reduce Europe’s dependance on Russian oil; and put a pause on LNG permits. Natural gas combined cycle, the the technology of choice in a free market, is as cheap as ever, representing the path not taken.
Whether it is the unprecedented subsidies for renewable energy or the unprecedented war on American energy, the Biden administration’s policies are behind the increase in America’s electricity prices.
Wholesale Prices Up 72%
Wholesale electricity prices are the best indicator of the direction of electricity prices. State regulations on retail prices often shield consumers from immediate exposure to rising energy prices. Eventually, though, consumers will bear the full brunt of higher wholesale electricity costs either through higher retail electric prices, lower income, or higher prices for other goods and services.
Figure 1 shows the “all-in” energy prices for the seven U.S. Independent System Operators or Regional Transmission Organizations. These areas cover about 70% of the electricity used in the United States, which roughly corresponds to the percent of U.S. population in the service areas.
The average wholesale price of electricity across these service areas from 2021 to 2023 was $70 per megawatt hour, up from $41 from 2018 to 2020. This means the average wholesale electricity price during the first three years of the Biden administration jumped 72% over the average price of the last three years of the Trump administration.
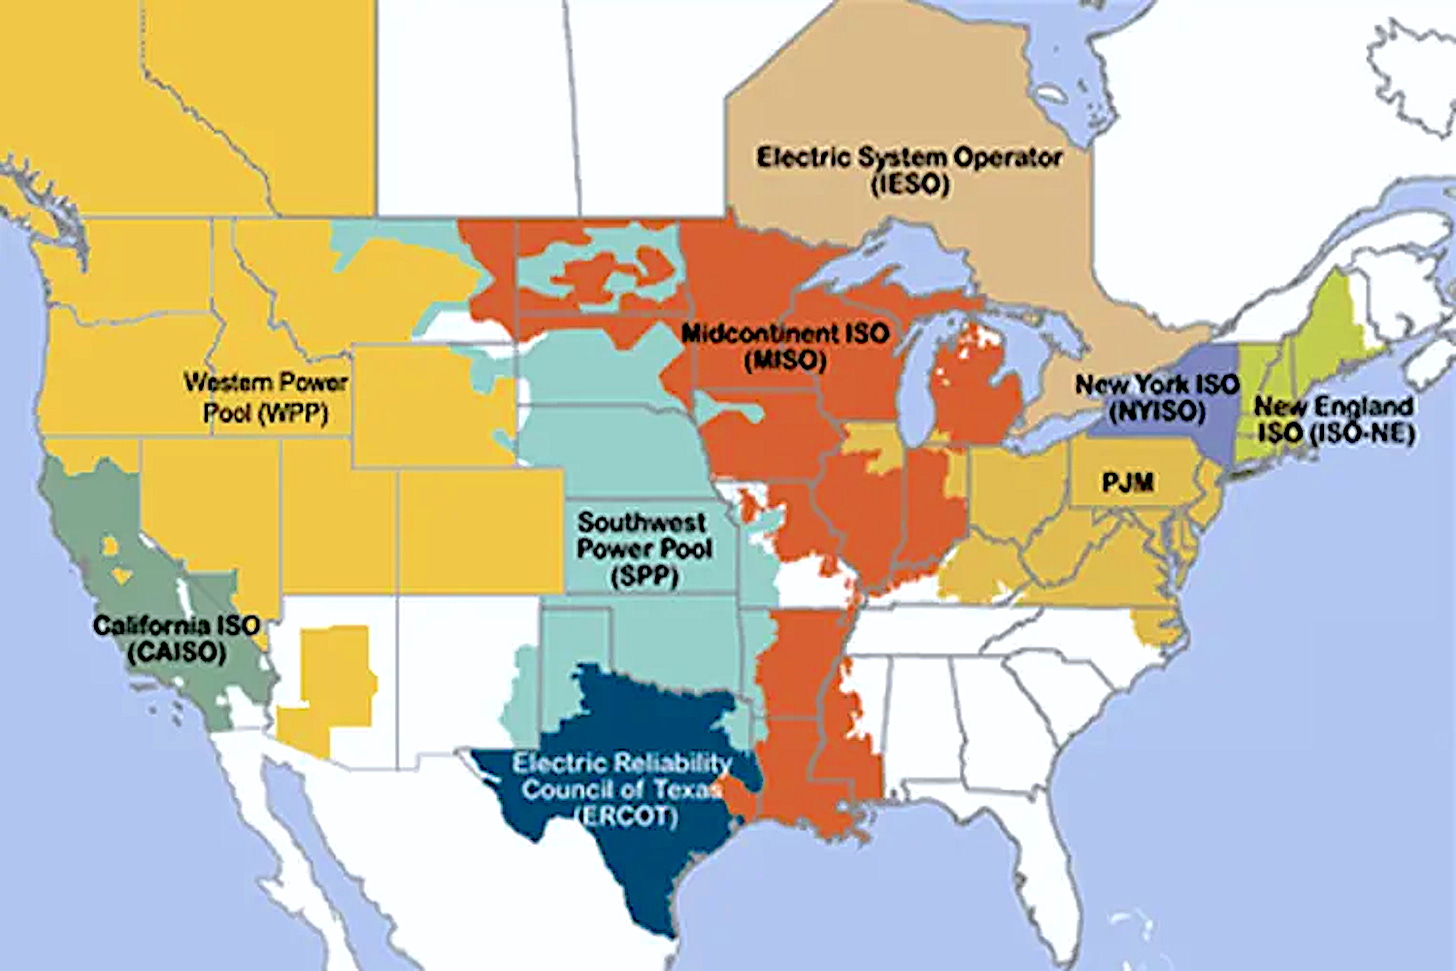
ERCOT, which covers most of Texas, had the highest average wholesale price over the last three years at $117. It also had the highest three-year increase at 208%. ISO New England had the second highest average price at $81, followed by California ISO at $80. CAISO also had the second highest three-year price increase at 81%. New York ISO was next averaging $68, although prices in New York City were considerably higher at $80. The service areas for these and other service entities are shown below (Figure 2).
Retail Prices Up 20%
Despite the regulatory brakes on increases, Figure 3 (below) shows that retail prices have also been rising rapidly during the Biden administration.
For 2024 year-to-date, residential electricity prices have averaged 16.34 cents per kilowatt hour. This an increase of 3.19 cents, or 23%, from 2020, the last year of the Trump administration. For all end users in the residential, commercial, industrial, and transportation sectors—prices are up 2.39 cents, or 23%, during the same period. Retail prices rose much more slowly during the Trump administration. Residential prices rose only 5% and for all end users only 3%.
There is no doubt that these increases in end-user electricity prices are only the beginning. The recent increases in wholesale electricity prices are already baked into the future retail electricity prices. Regulators will consider the higher costs that generators are incurring and increase future retail prices.
Biden’s Energy Policies At Fault
Across the news, headlines scream about the housing affordability crisis. “Housing on the ballot: Harris, Trump push different plans for tackling housing affordability crisis,” says AP News. The Economic Times asks the question, “US housing crisis: Why is America facing shortage of homes and will this crunch revive inflation?”
Yet very few are talking about a crisis of energy affordability. This is interesting, considering housing prices are not increasing much faster than electricity prices. For instance, housing prices in Texas’s four largest metro areas (Dallas/Fort Worth, Houston, Austin, and San Antonio) are up 25% over the last four years, not much more than U.S. residential electricity prices and far less than wholesale prices. Perhaps the reason for this difference is that most people who know what is causing electricity prices to increase do not want to talk about it.
The Cost of Renewable Energy Subsidies
In a recent article, The Problem with Solar, the authors wrote that the problem with solar is “it’s basically free—but at the same time it’s hideously expensive.” They got it half right.
Their reason for optimism about solar is “the cost curves for photovoltaic generation have come down farther and faster than anyone thought possible. Cue the breathless headlines: “the age of basically-free solar power for all is upon us!” This is a very common message in both media and academia these days. The only problem with it is that it is completely wrong.
Solar, like wind, can appear cheap when one focuses only on the generation of electricity taking place in the moment. The sun shines, the wind blows, and electricity is generated. No fuel costs at all. Yet this misses the 90% of the renewable iceberg that is underwater.
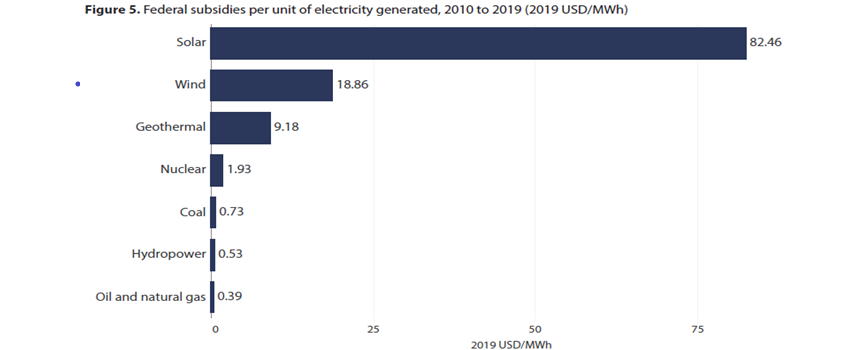
The only reason solar and wind are part of the U.S. commercial electric grid is because of subsidies. Figure 4 above shows that renewable energy subsidies last decade were double those for fossil fuels and five times those for nuclear. But this does not show the full story. Bennett et al. give us the rest in Figure 5 (below).
From 2010 through 2019, solar received $82 per megawatt hour of electricity generated. That is 42 times the amount of subsidies per megawatt hour nuclear received, 112 times coal, and 211 times oil and gas. For wind, its multiples were 10 times nuclear, 26 times coal, and 48 times oil and gas. The “free” wind and solar generation actually cost taxpayers $74 billion last decade in federal subsidies, without including the cost of the electricity or state and local subsidies.
As costly to taxpayers as renewable energy subsidies were last decade, this decade the costs are exploding. Figure 4 shows that renewable subsidies will more than triple this decade and will be ten times more than both fossil fuels and nuclear, not taking into account the per megawatt hour measure of the subsidies. The primary reason for the increase in renewable energy subsidies this decade is the Inflation Reduction Act.
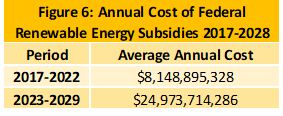
Figure 6 below shows that from 2017 through 2022, the year President Biden signed the Inflation Reduction Act into law, the average annual cost of renewable energy subsidies was $8.1 billion. However, once the IRA went into effect in 2023, the average cost of renewable energy subsidies tripled to $24.9 billion annually. The harm that renewable energy was doing prior to the IRA has accelerated with the cost of maintaining grid reliability rapidly increasing because of the growth of renewables.
The Reliability Cost of Renewable Energy
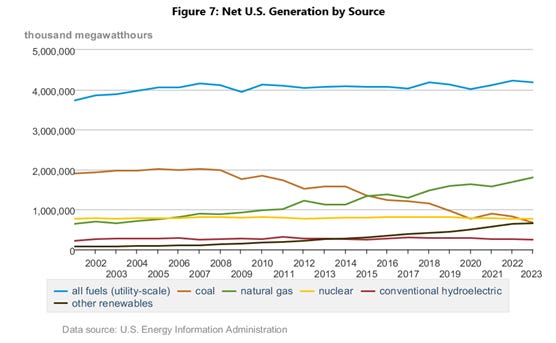
A remarkable event occurred in 2023; coal, nuclear, and renewable energy converged to become essentially equal generation sources on the U.S. grid. This would have been unthinkable a quarter of a century ago. Figure 7 shows the growth of renewables from essentially zero generation to almost equaling coal, which is generating less than half of its output from 2001, and being only slightly below nuclear.
This convergence signals a new chapter in the long-running battle to maintain grid reliability in light of two major generation sources–wind and solar–that cannot be counted on to generate electricity when it is needed.
The key feature of wind and solar as generation sources is their intermittency. This means that unlike coal, natural gas, and nuclear generation, they are only available when nature cooperates. This adds tremendous—and generally unacknowledged—costs to maintaining the reliability of the grid.
Going back to the article, The Problem with Solar, its authors explain why a seemingly inexpensive energy source is nothing of the kind:
The answer is that, yes, solar power generation has become close to free… but only when the sun is shining. Which happens some of the time, but not all of the time, not predictably and not necessarily at the times people need power the most.
The dirty little secret is that, at the scale relevant to most people, solar generation’s cost advantage is sort of beside the point. For solar to serve as the backbone of a grid, it needs to be backed with storage. That can come in the form of batteries, hydrogen, or pumped hydro. All of these are expensive; none of them scale. Storing a kilowatt-hour of electricity in a chemical battery costs an order of magnitude more than just generating it in a nuclear power plant. Which is why a 100% solar grid would be insanely expensive, even though generating solar power is basically free.
This also applies to wind, and explains in laymen’s terms what scientists have said for years; it is a well-known fact that the reliability value of renewable energy declines as its grid penetration increases. Which means that either batteries or natural gas backup generation must be on standby for those periods when the wind doesn’t blow or the sun doesn’t shine. While batteries are insanely expensive, backup natural gas generation is merely stark raving mad expensive.
Energy researcher Robert Bryce explains why continuing the growth of renewables is not only expensive, but also impossible. Bryce examined a 2023 report by Tesla that claimed that we could transform the world’s electric grid in about 20 years to support a “sustainable energy economy,” one that relies almost completely on renewables. Bryce highlights Tesla’s claim “that building the infrastructure for a ‘sustainable energy economy will cost $10 trillion.’” At $500 billion a year, that is 20 times the current level of renewable energy subsidies. Bryce also shows that electricity from solar is getting more, not less, expensive. He then explains the physical impossibility of Tesla’s plan:
Nevertheless, it only takes a minute to understand why that 240 TWh of storage is so gobsmackingly silly. First some basics. Recall that 1 TWh is equal to 1,000 gigawatt-hours (GWh) and that one Gigafactory can manufacture about 50 GWh of batteries per year. Tesla currently has 5 Gigafactories. Thus, Tesla’s current battery storage output is, in rough terms, 250 GWh per year. Now recall that the Master Plan requires 240 TWh, which is 240,000 GWh. Therefore, as can be seen in the graphic directly above, producing 240,000 GWh of battery capacity would require the output of all of Tesla’s existing Gigafactories for the next 960 years.
The high costs, failing reliability, and physical challenges of building and maintaining a grid dominated with wind and solar generation is not just a problem for the future, however. The growth of renewables fueled by government subsidies—and exacerbated by Biden’s Inflation Reduction Act—is causing major problems today. Texas provides a real-life example.
The Texas Example
As noted above, Texas leads the nation with a 208% increase in wholesale electricity prices over the last three years. Why would Texas, which leads the nation in natural gas production and has long relied on it to generate electricity, experience price hikes because of wind and solar generation?
The short answer is that Texas also leads the nation in generating electricity from renewable energy. In 2023, 34% of electricity generated in Texas came from wind and solar. The longer answer also helps explain why Texas is experiencing more reliability problems because of renewables than any other state.
The ERCOT portion of the Texas grid, which serves 27 million customers, is the only ‘energy-only’ electric market in the United States. What this means is that decisions about building new generation are left to the market, not to regulators as is done in other states. This worked well in Texas for about 15 years, as long as market prices were allowed to balance the needs of generators and consumers. Investors found many opportunities to profitably invest in new, primarily natural gas, generation that led to robust grid reliability and affordable prices.
However, as renewable subsidies and renewable generation continued to grow, they distorted market prices and led to almost all new investment going to renewables. Over the five-year period from 2018 to 2023, generation from coal-fired plants fell 34%, nuclear generation was down 1%, and natural gas generation was up only 17%. Meanwhile, generation from wind increased 55% and solar generation was up 900%.
The situation is getting worse. ERCOT forecasts renewable generation will increase by 58,654 megawatts through 2029 (wind by 3,628 megawatts, solar by 36,868 megawatts, and batteries, which also receive billions in subsidies, by 18,158 megawatts). Thermal resources, however, will only increase by 1,074 megawatts. Renewables are projected to make up 98.2% of new generation on the Texas grid over the next five years.
The reason for this shift to renewables is simple. It is now more profitable in Texas to build new solar and wind generation than natural gas. This is not, though, because renewables are inherently profitable investments. It is solely because of renewable subsidies. In 2024, the subsidies will increase the return on investment for generators by about 30% above what they earn selling electricity.
The result of the shift to wind and solar has been a rapid decline in grid reliability. There are two types of reliability problems caused by renewables. The first is caused directly by the intermittency of renewable generation. When changes in weather conditions cause declines or outages of renewable generation, complicated and costly steps must be taken to bring backup natural gas generation online.
The second problem is the long-term decline in reliability caused by renewable energy subsidies. This was on display in 2021 when, thanks largely to renewables, Texas experienced perhaps the worst blackout in American history during Winter Storm Uri. When wind and solar generation failed during the storm, there was not enough backup generation to compensate. Though natural gas generation also experienced problems, if the money that had been invested in renewables had instead gone to natural gas—or nuclear or coal, there would have been enough generation to possibly avoid the blackout entirely, or at least to ensure that Texans only experienced temporary 30-minute rolling blackouts.
Dealing with both types of reliability problems is “insanely” expensive. And because of Texas’s market design—and the way Texas politicians have chosen to deal with the problem, the costs are more transparent than they are in other states.
The best way for Texas to deal with its growing reliability problem would have been to eliminate all state and local renewable subsidies and force renewable generators to pay for the cost imposed on the grid by federal renewable subsidies. Instead, Texas politicians decided to double down on subsidies by giving them also to thermal generators. Texas began this process about 2014 when the reliability issues of wind generation and renewable subsidies began showing up on the ERCOT grid.
Then in 2019 politicians and regulators greatly increased the thermal subsidies, and did so again in 2021 and 2023 because of the Uri grid failure (Figure 8). The cost of Texas thermal subsidies in 2023 was $16 billion, in addition to the $4 billion renewable received. This effort, mistaken as the approach might be, demonstrates the high costs renewables are imposing on the U.S. electric grid, why Texas led the nation in wholesale price increases over the last three years, and why electricity prices have risen during the Biden administration.
A Brief Word about Natural Gas Prices
According to Potomac Economics, “There are two primary drivers of [electric] market prices: natural gas prices and the number of hours of supply shortages during the year.” There has been a correlation between gas and electricity prices over the period this paper examines, but it has lessened as the growth of renewables created new cost-increasing grid shortages that did not previously exist.
One of these new shortages is the “duck curve,” the time when there “is an increased need for electricity generators to quickly ramp up energy production when the sun sets and the contribution from PV falls.” This sunset shortage did not exist before solar came online. As the U.S. Department of Energy explains, “High solar adoption creates a challenge for utilities to balance supply and demand on the grid.”
Wind has created similar shortages. Wind output can be reduced over long periods of time, as it was in 2023. But it can also happen daily. Whether these shortages are long- or short-term, expected or unexpected, it costs a lot of money to have alternate generation on standby and even more when it is necessary for the generation to run. These renewable-induced shortages have added to the cost of electricity as renewable generation grid penetration has increased while reducing the correlation between natural gas and electricity prices.
Whatever the correlation is between natural gas and electricity prices, the Biden administration’s energy policies have had a significant effect on natural gas prices. Rep. Dan Newhouse summed up the administration’s Unprecedented War on American Energy: “From cancelling the Keystone XL Pipeline to revoking leases for oil, gas, and mining across the West, it is clear the president’s unprecedented war on domestic energy producers has put the United States in a vulnerable position.” All of this and other policy decisions raised natural gas prices. Thus, to the extent that natural gas prices correlate to increases in electricity prices, this still points to the Biden administration.
Conclusion
Whether it is the unprecedented subsidies for renewable energy or the unprecedented war on American energy, the Biden’s administration’s policies have led to a significant increase in America’s electricity prices.
Bill Peacock is the policy director of the Energy Alliance. He has worked in and around the Texas Legislature for more than 30 years.
#Peacock #MasterResource #EnergyAlliance #Climate #ElectricPrices #Subsidies #Biden #Solar #Wind #NaturalGas


The fact that solar and wind are not dispatchable means that all utility power including the line frequency and voltage must be supplied by conventional generators. The utility contribution of a conventional generator to a conventional grid averaged between 6% to 10% of plant capacity.
Hopefully enough Americans are aware of this reality, as several of the Biden / Harris energy policies are very bad in several respects.